|
|
|
|
|
|
 ;
;
;
;
;
;
;
;
| Read more ...... |
 |
OverviewMetaboAnalyst is a comprehensive platform dedicated for metabolomics data analysis via user-friendly, web-based interface. Over the past decade, MetaboAnalyst has evolved to become the most widely used platform (>300,000 users) in the metabolomics community. The current MetaboAnalyst (V5.0) supports raw MS spectra processing, comprehensive data normalization, statistical analysis, functional analysis, meta-analysis as well as integrative analysis with other omics data. The objective is to enable high-throughput analysis for both targeted and untargeted metabolomics, and to narrow the gap from raw spectra to biological insights. |
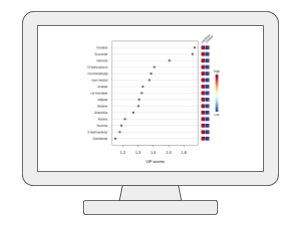 |
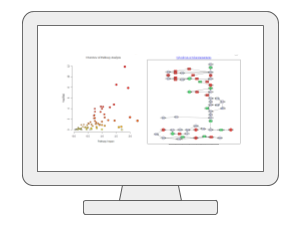
Statistical Analysis [one factor]A wide array of commonly used statistical and machine learning methods are available: univariate - fold change, t-test, volcano plot, ANOVA, correlation analysis; advanced feature selection - significance analysis of microarrays (and metabolites) (SAM) and empirical Bayesian analysis of microarrays (and metabolites) (EBAM); multivariate - principal component analysis (PCA), partial least squares-discriminant analysis (PLS-DA) and orthogonal partial least squares-discriminant analysis (OPLS-DA); clustering - dendrogram, heatmap, K-means, and self organizing map (SOM); as well as supervised classification - random forests and support vector machine (SVM). |
 |
Statistical Analysis [metadata table]MetaboAnalyst now allows users to visualize and compute associations between phenotypes and metabolomics features with considerations of other experimental factors / covariates. It employs general linear models to accommodate modern epidemiological study, together with PCA and heatmaps for visual explorations. For two-factors / time-series data, users have more options including two-way ANOVA, multivariate empirical Bayes time-series analysis (MEBA), and ANOVA-simultaneous component analysis (ASCA). |
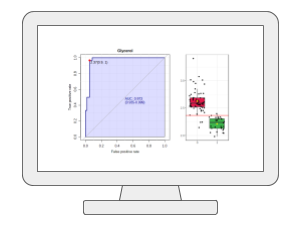 |
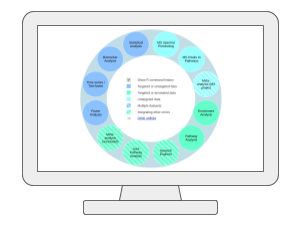
Biomarker AnalysisMetaboAnalyst provides the receiver operating characteristic (ROC) curve based approach for identifying potential biomarkers and evaluating their performance. It offers classical univariate ROC curve analysis as well as more modern multivariate ROC curve analysis based on PLS-DA, SVM or Random Forests. In addition, users can manually select biomarkers or set up hold-out samples for flexible evaluation and validation. |
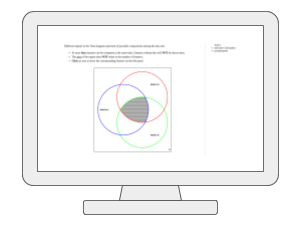 |
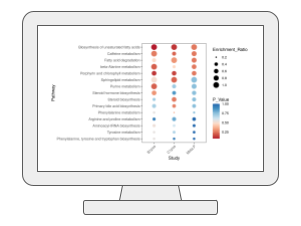
Statistical Meta-analysisUsers can upload several annotated metabolomics data sets collected under comparable conditions to identify robust biomarkers (compounds or annotated peaks) across multiple studies. It currently supports several meta-analysis methods based on p-value combination, vote counts and direct merging. The results can be explored in an interactive Upset diagram. |
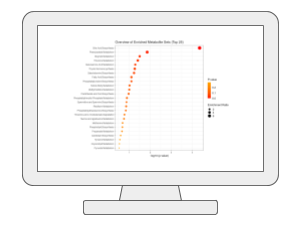 |
Enrichment AnalysisMetaboAnalyst performs metabolite set enrichment analysis (MSEA) contains human and mammalian metabolite sets, as well as chemical class metabolite sets. This module accepts a list of compound names, a list of compound names with concentrations, or a concentration table. The analysis is based on several libraries containing ~9,000 biologically meaningful metabolite sets collected primarily from human studies including >1500 chemical classes. |
 |
Pathway AnalysisMetaboAnalyst currently supports metabolic pathway analysis (integrating pathway enrichment analysis and pathway topology analysis) and visualization for 26 model organisms, including Human, Mouse, Rat, Cow, Chicken, Zebrafish, Arabidopsis thaliana, Rice, Drosophila, Plasmodium species, Budding yeast, E.coli., etc., with > 1600 pathways. |
 |
Joint Pathway AnalysisWith MetaboAnalyst, users are able to simultaneously analyze genes and metabolites of interest within the context of metabolic pathways. Metabolomics data from 25 model organisms including the human, mouse and rat are currently supported. Several algorithms have been implemented to integrate evidence from transcriptomics and metabolomics for systems level insights |
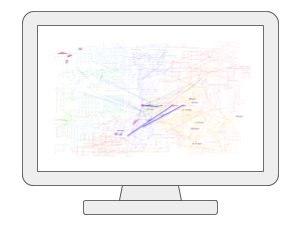 |
Network AnalysisUsers can upload one or two lists of metabolites, genes, or KEGG orthologs (i.e. generated from metagenomics), and then visually explore these molecules of interest within the context of biological networks such as the KEGG global metabolic network, as well as several networks created based on known associations between genes, metabolites, and diseases. |
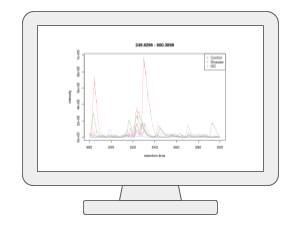 |
LC-MS Spectral ProcessingUsers can now upload their LC-MS spectra to perform peak picking, peak alignment and peak annotation using auto-optimized parameters for XCMS and CAMERA. The input spectra must be in centroid mode and open formats (mzML, mzXML and mzData). The resulting peak intensity table can be exported to other modules to allow comprehensive statistical or functional analysis. |
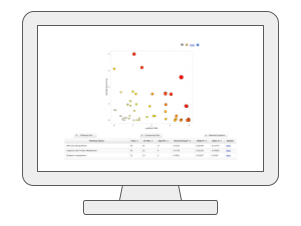 |
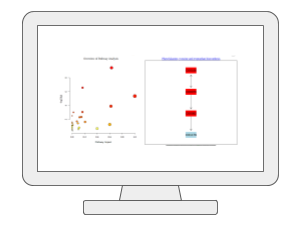
MS Peaks to PathwaysThis module supports functional analysis of untargeted metabolomics data generated from high-resolution mass spectrometry (HRMS) such as LC-HRMS or FI-HRMS. The basic assumption is that putative annotation at individual compound level can enable more accurate functional analysis at pathway level. This is because pathway-level changes rely on "collective behavior" which is more tolerant to random errors during compound annotation (Li et al. 2013). |
 |
Functional Meta-analysis of MS PeaksWith MetaboAnalyst, users can now perform meta-analysis of untargeted metabolomics data. Our method extends the MS Peaks to Paths workflow to reduce the bias individual studies may carry towards specific sample processing protocols or LC-MS instruments. The current workflow allows users to perform meta-analysis of MS peaks to help identify consistent functional signatures by integrating functional profiles from independent studies or by pooling peaks from complementary instruments. |
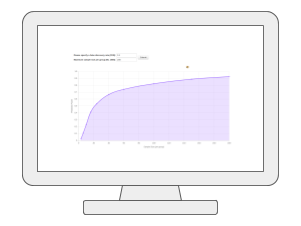 |
Power AnalysisUsers can upload a dataset either from a pilot study or from a similar study to compute the minimum number of samples required to detect the effect within a certain degree of confidence, as well as to estimate the power of the current study design. |
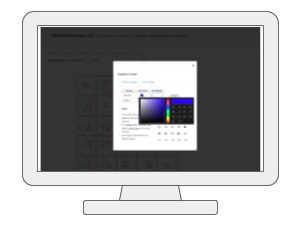 |
Image GenerationPublication quality image generation is an important feature of MetaboAnalyst. Important images can be customized ( colors, shapes or labels) and re-produced in high resolution in various formats such as .png, .tiff, .ps, etc. |
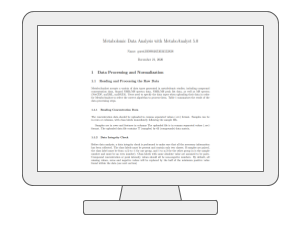 |
Report GenerationUpon completion of your analysis, a comprehensive PDF report will be generated documenting each step performed along with corresponding tabular and graphical results. All processed data and images are also freely available for download. |